Home
Mailgun Blog
Product category
Breaking Down The Data: A New Reporting Dashboard for Your Email Metrics
Product
Breaking down the data: A new way of viewing your email metrics
For months, we’ve worked in tandem with our partners and resellers to be able to bring you the most comprehensive email data. Today, we’re proud to introduce our Reporting Dashboard to all Mailgun users.
PUBLISHED ON
Data is rich. Gleaning insights on recipient trends, content effectiveness, and message irregularities are hidden in email data, waiting to be uncovered by senders looking to fully understand email performance. But breaking them into these details is tedious, especially now that open rates are becoming increasingly less important in the email space.
So how can you find reliable and actionable data to take your email program to the next level? At Mailgun, we’ve been working in tandem with our partners and resellers to bring you all the insights you need. Mailgun users, say hello to our new Reporting Dashboard.
Data you can trust
Over the last few months, something has become apparent: we can’t trust open rates. Nowadays, it’s more prudent to compare historic click rates with current campaigns at a level as granular as you need.
But this data drill-down grows in complexity for our partners when breaking down data by customer, campaign, and specific emails. As customers big and small grow with Mailgun, we strive to provide an experience that makes gathering insights that affect your business easier.
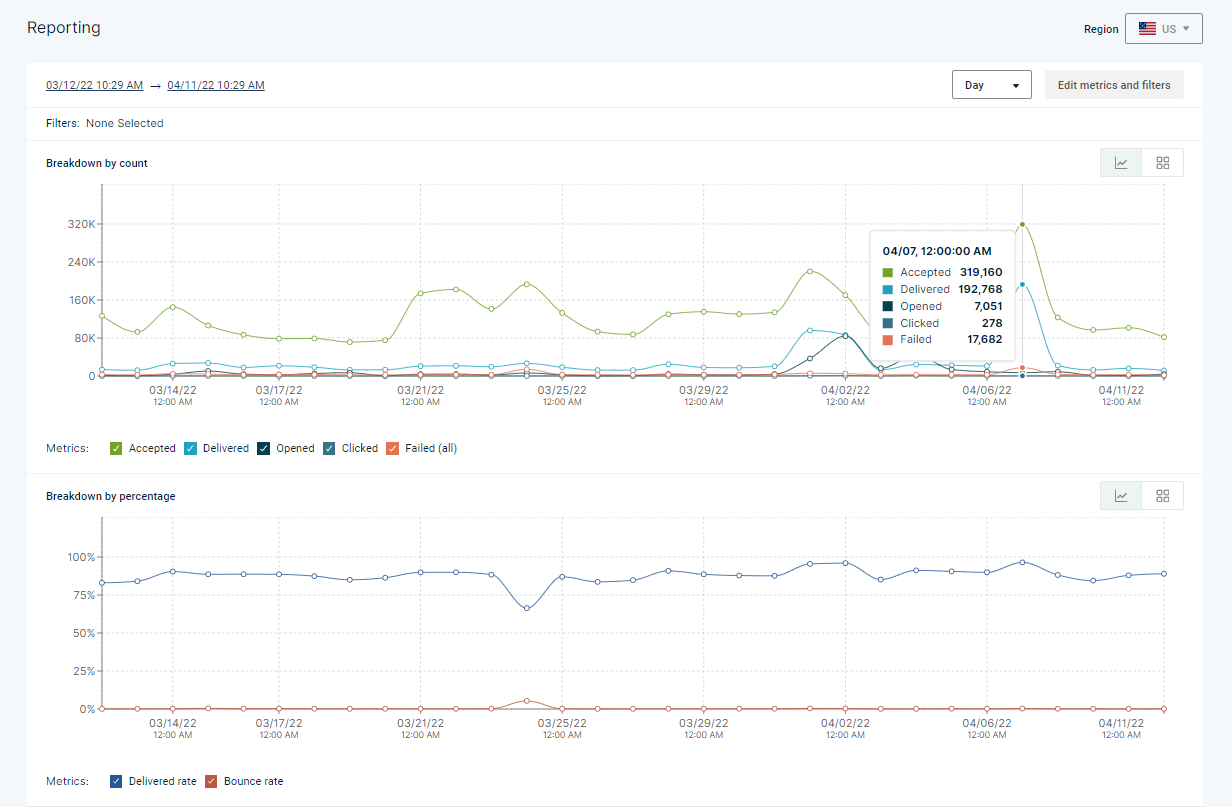
Data visualization customizable to you
Analysts and engineers deserve the ability to visualize data quickly and at their preferred complexity for their entire account. However, no two businesses have the same set of email recipients – different users have different data visualization needs.
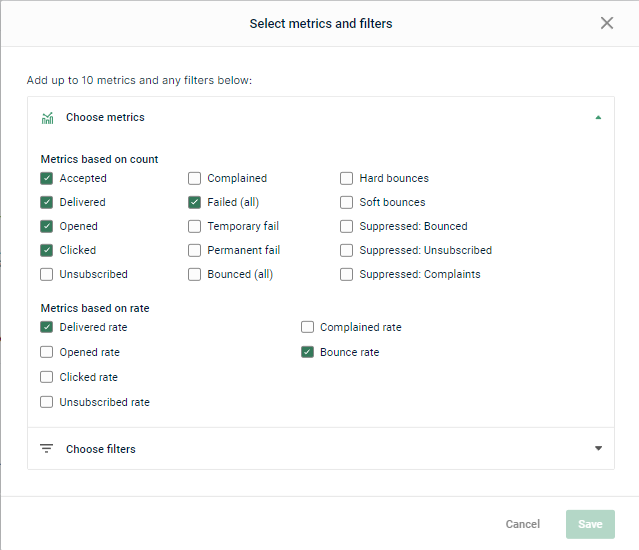
Flexibility has always been critical to our product development and was a key ask from our partners during the early tests of the Reporting Dashboard. We decided to take the most requested metrics from across our sending platform and make them the core filters. Senders now have the ability to add up to 10 metrics and any number of filters and can splice their data into multiple drill-downs and identify trends on the fly.
Drill down by domain
Aggregate data is ideal for an account-level view, but we understand that some senders need to be able to filter down. In the past, resellers were left to visualize customer data independently, with most grabbing the metrics from the domains tab. This left resellers unable to compare customers in similar industries simultaneously, making it challenging to identify trends. Without the ability to compare metrics, resellers could miss the mark on providing valuable email insights to their customers.
Mailgun resellers were vocal in the Reporting Dashboard early concepts: They made it clear that domain drill-downs would greatly improve their overall experience. Outside of that request, we saw the benefit this would have for senders of all sizes. Multiple marketing streams segmented via domain, different brands, or even a simple marketing and transactional split could be compared visually, leading to better insight for better sending – just what we want for all Mailgun users.
Filter by time and date
Metrics can speak to complex successes and issues depending on the time of day they occur, and your analytics should reflect that. A lot can happen within the span of an hour, and even more so with an entire day. The ability to adjust the time frame of viewable data allows for analyzing data trends affected by send time and timezone influences.
Building for the future
With the Reporting Dashboard, we’re already looking ahead at what we can improve to build out its capabilities. In the coming year, we’re planning on some substantial changes to make it even better, including more recipient domain coverage, more filter options, heavier line weights, and updates to the calendar view. It will take some time, but keep an eye on the Reporting Dashboard for all improvements scoped for the future.
Iterating on our features is something we take great pride in as an email service provider. For years, Mailgun has improved our platform with the feedback we’ve received from customers on Uservoice and through our regular meetings with Deliverability Services customers.
If you’ve never hopped over to our Uservoice to look at the different feature requests, we highly recommend it. You can upvote feature requests that you want to support or add one yourself if you don’t see something listed. Either way, you help make us a better Mailgun.

